Experiences from Building Enterprise Agents (with DSPy and GEPA)
The project I have been working on for the past few months involves building enterprise agents to assist internal users with their workloads. For context, we are working with a consultancy that acts as an intermediary between educational institutions and clients.
This blog discusses this experience, covering data pipelines, agent architecture and scaffolding, building metrics, evaluation loops, and observability. The focus is primarily on the design and optimization aspects of the agentic loop--not hosting in production, which has its own separate set of challenges. I have abstracted away some implementation details as this is being developed for internal use.
The agents are designed to enable internal users to look up and coordinate information from databases, compare options, sort clients based on their profile attributes, submit application requests on their behalf, check compliance against client–provider constraints, and surface other task-relevant information. Internally, there are separate teams handling different parts of this workflow like the compliance team, the team that manually coordinates the client-provider matching workflow, and the application team that submits requests with all required information. The goal of the agent is to compress this fragmented workflow, allowing a single individual to manage the full process while handling multiple client profiles in parallel.
Note: The following assumes readers are familiar with what DSPy is and how GEPA works. I do not discuss these details. However, the training section highlights how I have used the combination of these to optimize the prompts.
Contents
- The Core Challenge
- Why DSPy + GEPA
- Agent System Architecture and Scaffolding
- Data
- Optimizing with GEPA, Metrics, Evals, and Observability
- Context Management
- Conclusion and Future Thoughts
The Core Challenge
The primary technical challenge in automating such enterprise workflows is the lack of data that maps the underlying decision flow and reasoning involved. These workflows also involve multiple teams with varied roles, making it difficult to collect data in a consolidated structure.
The approach I finalised on was to decompose the control flow into smaller tasks, create template data in collaboration with internal domain experts, synthetically expand this data using LLMs, optimize modular agent components on these tasks, probe for failure modes, iterate on the data, and repeat. This sounds exhausting and chaotic without a unified workflow pipeline--but I think such is the reality of building useful enterprise agents.
In practice, I would classify time spent on different parts of this as:
- 50% of the time crafting the dataset and workflow structure, iterating on it, making it more nuanced and signal-dense for agent actions, and manually inspecting every detail
- 30% of the time iterating on the agent architecture and scaffolding
- 20% of the time trying to evaluate and break what is being built and finding loopholes
We are currently running a pilot version internally with some users to gather feedback and collect more practical data.
Why DSPy + GEPA
When I started working on this, as mentioned, the main challenges were the absence of usable data and a lack of clarity on how to architect the compound system or build the scaffolding. Breaking down the complex tasks into smaller modular components and then refining them, while iteratively developing a better understanding of what data we need for training, seemed like a feasible approach to get things working. This aligns well with the core philosophy behind DSPy's composable modular programs, and GEPA facilitates the low-cost, quick-iteration loops for optimization to test feasibility.
At its core, the system uses DSPy Signatures to define modular agent components, GEPA as the optimization algorithm, and custom code for all scaffolding, evaluation, and observability. In principle, one can accomplish the same without the DSPy layer by writing their own custom wrappers around LLM calls and optimize directly with GEPA. However, the Signatures abstraction is quite intuitive to work with in this case and integrates well with the modular aspect of building compound systems. As long as the tokens-in/ tokens-out nature of llms persists, this abstraction remains valid.
Agent Architecture
The system employs a multi-agent architecture, featuring a triage agent at the top and three specialized sub-agents: a compliance agent, a task agent, and a RAG agent.
- RAG Agent: Answers queries based on internal documents and enterprise fact checking
- Compliance Agent: Checks and validates user input against certain compliance metrics, can also initiate submission requests
- Task Agent: Does the heavy lifting of looking up different entities across the database based on free-form user queries, performing heuristics such as comparisons, checking availability, and answering questions about those entities and other information specifics
The triage agent generates a plan based on user input, determining which sub-modules to call serially to accomplish a task. This plan is then executed by calling those modules. Modules execute only in sequence (as of now), with the output of one feeding into the next. This serial execution is intentional, as it guarantees proper execution and hand-off, although it may compromise latency. The triage agent's plan can call a single sub-agent, multiple sub-agents, or one agent multiple times within a single plan.
Each sub-agent (including the triage agent) is optimized separately with different datasets refined over several iterations. For the purpose of this blog, I will focus on a single sub-agent --the task agent, and describe the relevant aspects to keep things concise, while noting that most ideas are identical for the other blocks.
Note: In my experience, it is also beneficial to have an understanding of the UI where this will be deployed, as some architecture design choices can be influenced by it.
Sub-Agent Architecture
To build reliable agents in enterprise settings, the system must balance LLM non-determinism with traditional software determinism. Keeping this in mind, the design choices for the agent architecture and scaffolding attempt to strike this balance.
The task sub-agent is composed of three modules: the context module, the functional module, and the summarizer module. In typical DSPy fashion, each module has its own signature. This is where the core value of DSPy abstractions lies--breaking down a sub-agent into modular signatures which are then composed together.
The first two modules accept free-form text as input and emit an action from a strictly predefined action space. The actions here are tool call names and their arguments. The final module acts as a summarizer, with the final tool call output as its input and a structured output. The tools themselves are Python functions that can be used for preprocessing, validation, API calls and other internal checks based on context.
Restricting the first two modules to action outputs helps reduce the non-determinism of LLMs, while keeping a significant portion of the overall control flow deterministic. So the LLMs never produce arbitrary API calls/strings/code. This also facilitates building strong evaluation metrics, observability into the system, and guardrails. The Python functions can have their own traditional software engineering validations to prevent misuse or external attacks. The tools can be evolved or refined separately in the future if the system backend architecture changes--but the agent should still work as long as the tool call arguments and the logic of when to call which tool remain consistent.
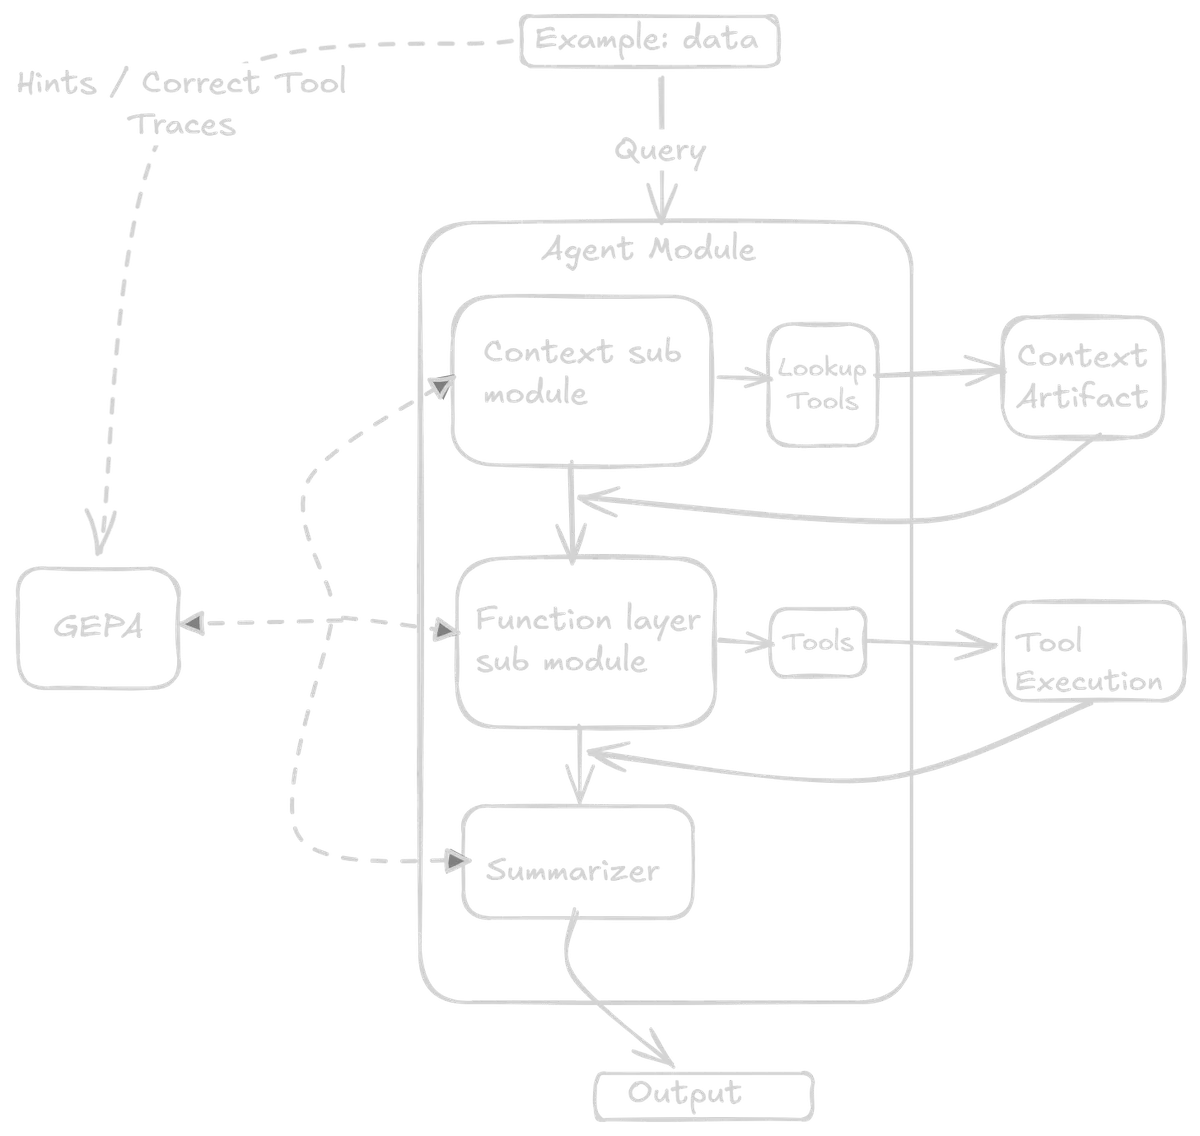
Context Module
The context signature has an input field for the user request and an output field that is a Pydantic model of possible actions. These possible actions include four tool names: the first three point to different queries within the context object, and the fourth is no_lookup.
The context (more on this later) is a separate artifact managed and built independently of the agent. For example, if the user requests references to entities from a previous turn--say, comparing attributes of items returned earlier in the conversation, this module should output the appropriate lookup tool to retrieve that information from the stored context. Different query types map to different lookup actions. If no context lookup is needed, then no_lookup is the output and the query passes directly to the next module.
Functional Module
Once the previous tool is executed, the initial user query, along with the tool call output, is passed to the functional module as input. The output fields here are five different string fields for entity extraction and an action. The string fields are tool arguments, such as search query names and other filters. The possible set of actions includes four different tools.
Summarizer Layer
The last module takes the tool output along with the initial request as input. The output is a defined Pydantic schema with two fields: a text string for the natural language response, and an entities list containing typed objects with fields like database IDs, names, and relevant metadata.
This dual-output structure is where understanding the UI pays off. The text field presents results in natural language (e.g., heuristic results, comparison summaries, answers to questions), while the entities list provides structured data that the UI can render as clickable elements--linking to detail pages and serving as validation sources for the response.
This structure enables a few other things, like:
- The UI can maintain a history of interacted objects accessible via a slide-out panel (useful from a user pov)
- The agent can prompt the user to select specific objects to continue the workflow. These selected IDs and metadata can be passed forward without additional tool calls or external context gathering.
Finally, these structured outputs are passed to the context artifact where they are accumulated separately. Only the short text output is appended to the next query as conversation history. This keeps the context window compact, with entity lookups handled via the context module--reducing token count, improving latency, and preventing context blowup.
Validation and Error Handling
At each step of the tool call, there are assertion checks and validations. If the LLM hallucinates or wrong API calls are made, the flow can be aborted, and appropriate error messages surfaced to the user. In some preset error cases, the error message is also rerouted to the previous or next module so it can deal with it.
What Did Not Work
Earlier iterations of this sub-agent setup used a ReAct module for tool calls as a single module along with a summarizer module. However, some issues I encountered:
- The overall system became slow, sometimes getting stuck in error loops
- The context window grew quickly
- It did not provide the necessary observability
- It made it difficult to maintain the separated context object
In general, for such use cases, it may be better to separate out the LLM calls as an input-process-action mechanism and carry out the function calls separately with necessary validation.
Data
As mentioned earlier, the workflows being automated span multiple teams, and most task logic exists only as tacit knowledge rather than structured documentation or executable specifications.
Collecting Control Flow Data
Building the dataset involves collecting these control flow decisions--capturing across the entire workflow what API calls are required at each stage, how the control flow runs from a top-down view, and then breaking them down into modular components for each sub-agent. In this case, it is beneficial to have:
- An understanding of what the end user wants to accomplish with these agents from their perspective
- An understanding of what API calls and functionalities are triggered at the backend when a human performs the same task manually
To this end, having a good grasp of the business context and the backend code/architecture is beneficial. Having built some of the backend myself and closely collaborating with other teams previously, it was convenient to map out these traces to form the data.
Data Collection and Refinement
The most critical part of the entire system is collecting and refining the data manually, then synthetically expanding it. This forms the basis for both the GEPA optimization and feedback, as well as the evaluation metrics.
This can be frustrating and tedious grunt work. It requires extensively reaching out to different internal stakeholders to understand their workflows, preparing template data files, filling them with quality data, and then refining them manually for the optimization loop.
After several iterations, a single row in the dataset can look something like this:
- The user query as input
- The context layer's correct tool call action name
- The logic behind why this was the correct context tool required
- The functional layer's correct tool call action
- The logic behind why this was the correct functional layer tool required
- The correct set of tool call arguments
- In some cases, the final output text (left blank for generic simple questions)
Additionally, I pre-computed all tool calls, specifically the external API calls, and saved them locally. This saves time during optimization since the code does not have to make the same calls repetitively. For correct tool call cases, I directly pass the stored output. For incorrect tool calls, the modules are allowed to make them dynamically during training. The modules are also provided with a preset custom context artifact during each training instance.
Why This Works with GEPA
The advantage with GEPA is that it can be a good estimator of how well the modules work individually based on limited data--which is crucial as we iteratively collect, refine, and try out new things while making architecture changes. As long as the dataset captures a good mix of general use cases along with edge case examples, GEPA can iterate on this to produce clear, precise prompts.
Optimizing with GEPA, Metrics, Evals, and Observability
I will skip the details of how GEPA works and its internals. However, I want to highlight one implementation detail of the GEPA + DSPy backend and how I have used it in this context for training. I believe this might be well-known, but have found it to be a source of confusion in some cases.
Module-Specific Feedback
Since the final DSPy module here is composed of smaller modules with their own signatures, the way GEPA optimizes is one module (or signature) at a time in a round-robin fashion—iterating over the different modules serially. As such, it is much more convenient to target your feedback to the reflector LLMs for each specific module, providing information about what it did wrong, how to pass the right tool call logic, along with a broader, summarized view for context about what the whole module is trying to do.
The signatures during initiation contain minimal information, mentioning their purpose, what tools are available, and in what context to call each tool. The input and output field descriptions specify what kind of data to expect, and the rest GEPA figures out via the module-specific feedback it sees during optimization. The final module output contains the entire history of tool calls, query arguments, and other action metadata.
Configuring Metrics for GEPA Reflection
To this end, it is important to properly configure your metrics with the feedback and the trace, pred_name, and pred_trace parameters when writing metrics to be passed to the GEPA module during reflection:
- trace: Contains the whole trace execution of the program
- pred_name: Contains which predictor module GEPA is currently trying to optimize
- pred_trace: Contains that predictor's own trace
These are used to design custom feedback messages with tool calls and tool call logic particular to that predictor, along with an overall summary. This turned out to be quite effective--with the correct feedback mentioning why it worked (or did not) and what logic should make it work, GEPA can iteratively refine even with limited examples.
Code Example: Composite Metric with Module-Specific Feedback (click to expand)
def metric(example, pred, trace=None, pred_name=None, pred_trace=None):
    score = 0

    # get the correct tool names and the llm output actions
    context_tool = pred.context_tool
    context_expected_tool = example.context_tool
    functional_tool_llm = pred.functional_tool
    functional_expected_tool = example.functional_tool

    # scoring for tool selection
    context_tool_correct = context_tool.strip().lower() == context_expected_tool.strip().lower()
    functional_tool_correct = functional_tool_llm.strip().lower() == functional_expected_tool.strip().lower()

    if context_tool_correct:
        score += 0.5
    if functional_tool_correct:
        score += 0.5

    # Base feedback execution summary
    feedback = f"""
        Full Execution:
        - User Request: {example.user_request}
        - Expected Flow: context_tool={context_expected_tool} → functional_tool={functional_expected_tool}
        - Actual Flow: context_tool={context_tool} → functional_tool={functional_tool_llm}
        Instructions: {example.task_instructions}
    """

    # Module-specific feedback for GEPA
    # for eval mode the trace values are None
    if pred_name is not None and trace is not None:
        if pred_name == "context_module":
            if context_tool_correct:
                feedback += f"""
                    [context_module] CORRECT: Selected '{context_expected_tool}' as expected.
                """
            else:
                feedback += f"""
                    [context_module] INCORRECT: Selected '{context_tool}',
                    expected '{context_expected_tool}'.
                    Hint: {example.past_context_lookup_instructions}
                """

        elif pred_name == "functional_module":
            # Get upstream context from trace
            # trace[0] is the context module's execution: (predictor, inputs, outputs)
            # trace[0][2] accesses its outputs
            ctx_output = trace[0][2].look_up_index if len(trace) > 0 else None
            if functional_tool_correct:
                feedback += f"""
                    [functional_module] CORRECT: Selected tool '{functional_tool_llm}'.
                    Upstream context: look_up_index={ctx_output}
                """
            else:
                feedback += f"""
                    [functional_module] INCORRECT: Selected '{functional_tool_llm}', expected '{functional_expected_tool}'.
                    Upstream context: look_up_index={ctx_output}
                    Hint: {example.functional_lookup_instructions}
                """

        elif pred_name == "summarize":
            feedback += f"""
                [summarize] Formats tool results for user output.
            """

    return dspy.Prediction(score=score, feedback=feedback)
Evals and Observability
Connected to these metrics are evals and observability. Designing them properly is equally important as the data. These explain what is happening under the hood and every decision taken by the model, and whether those decisions align with the expected flow for a given task.
One of the benefits of writing custom code for all the agent harness or scaffolding is that at every layer, I have full control over LLM outputs: which control path redirects where and why. I can log them to CSV, print them, or handle them however I prefer. DSPy also has out-of-the-box support for MLFlow; in this case, both were used. I also vibe-coded a simple UI that takes all the log dumps and displays them the way I want, which helps iterate and refine my datasets.
The evals are mostly deterministic checks on tool use, tool selection, function call APIs, control flow, and function arguments. Most of this data is captured in the dataset, which specifies all correct tool flows and traces. The evaluator performs Python assertion checks, string regex matches, argument validation, and similar checks. These give good deterministic insight into the functioning of the agent, its control flow, and intermediate steps and actions.
There is also an LLM-as-a-judge component on the final string output that assesses the final text and acts as an entity extractor, ensuring it aligns with the personality, tone, and other attributes we want the output text to have. This is also a small DSPy module optimized with a few examples as a semantic extractor. The final output is captured and checked against certain attributes, scored numerically as an average of the number of matches.
Additionally, at the evals data level, there are some manually designed queries that probe certain edge cases or context lookups, storing the ground truths in the dataset.
Note: For this setup, optimization used approximately 200 training examples with metric calls limited to 200 for the GEPA optimizer. This number was chosen empirically-- previous iterations used significantly more. The base module LLM was Gemini 2.5 Flash, and the reflector LLM was Gemini 2.5 Pro. A single optimization run costs around £1-2, though with many iterations, the total estimated cost was approximately £120. The key takeaway is to refine and simplify the architecture and make the data as high-signal as possible.
Context Management
The context is maintained as a separate artifact that evolves deterministically after each turn of the execution. There are several options for how context can be managed:
- Ephemeral context: can be structured objects that evolve during the period tasks are conducted, and are then removed
- Persistent context: File system storage, Redis cache for cloud, or a structured database format (or even just
.txtfiles)
The key point is that context is completely separate from the agent architecture and evolves on its own deterministically. It can be stored locally or in the cloud for persistent storage.
There are many resources online about how to maintain context for agents, but two that particularly influenced this direction are:
How the Context artifact Works
For the agents here, what matters is why, how and when certain entities have been referenced in it's run. These are stored as key-value pairs with a strict schema in the context artifact. The context module is optimized to output the required lookup type and lookup key that needs to be queried from the context. That is then queried from the context artifact and added along to the user query for the next module in the agent flow.
The context artifact can evolve on its own as long as the core key-value structure is maintained in future iterations. This also helps maintain separate context artifacts for each sub-agent that can be handled or iterated on independently. Some of these can be ephemeral context, while others can be persistent. The overall agent context window stays relatively clean, lean, and fast.
For example, in the case of the task sub-agent, at the end of each complete task, a few things are extracted from the final output--such as entities that were queried or interacted with, their IDs, and other metadata, which are compacted and stored in the context. The short text string from the output is appended to the next user query as past history.
Conclusion and Future Thoughts
This work is still very much in progress and definitely needs improvements and further refinement to extract full value from such a setup. A version of this is being deployed internally to selected users for testing, collecting feedback, gathering real-use data and failure modes, and trying to better understand real-time workflows and what gaps have been missed from the development end.
Key Takeaways
Building such agents is difficult from the perspective of scoping out the actual functionality, since in practice, it is often cross-team functionality with many of the actual action execution workflows stored in the minds of human experts. Data quality and control flow architecture are the most important factors to consider. I recently read this article from Foundation Capital that has been circulating on Twitter, and it articulates some of these challenges in much better and clearer ways.
DSPy and GEPA provide a lot of room here to quickly iterate and get validation about what works and what does not. This enables me to iterate and refine my data, evals, and finally the architecture.
Future Work
I am looking forward to our internal use case evaluations and how much value they actually add to manual workflows. Some technical areas I am eager to improve, like reducing the LLM calls per execution for faster task completion, improving context management for production scale, testing smaller edge device models(like FunctionGemma), and exploring end-to-end finetuning if we collect sufficient real-time data.
All this initial work helps solidify what kind of automation we want, how much human-in-the-loop is needed, and what data is required. As things evolve, I may put out another write-up in a few months.
References
- DSPy Documentation
- DSPy - paper
- GEPA - paper
- Architecting Efficient Context-Aware Multi-Agent Framework for Production - Google Developers Blog
- Context Engineering for AI Agents: Lessons from Building Manus - Manus Blog
- Context Graphs: AI's Trillion Dollar Opportunity - Foundation Capital
- Adaptation of Agentic AI - paper
- Measuring Agents in Production - paper
- Google Gemini 2.5
- Anthropic blog